The United States is in some hot water financially.
This graphic is a comprehensive look at exactly the kind of mess we're in. 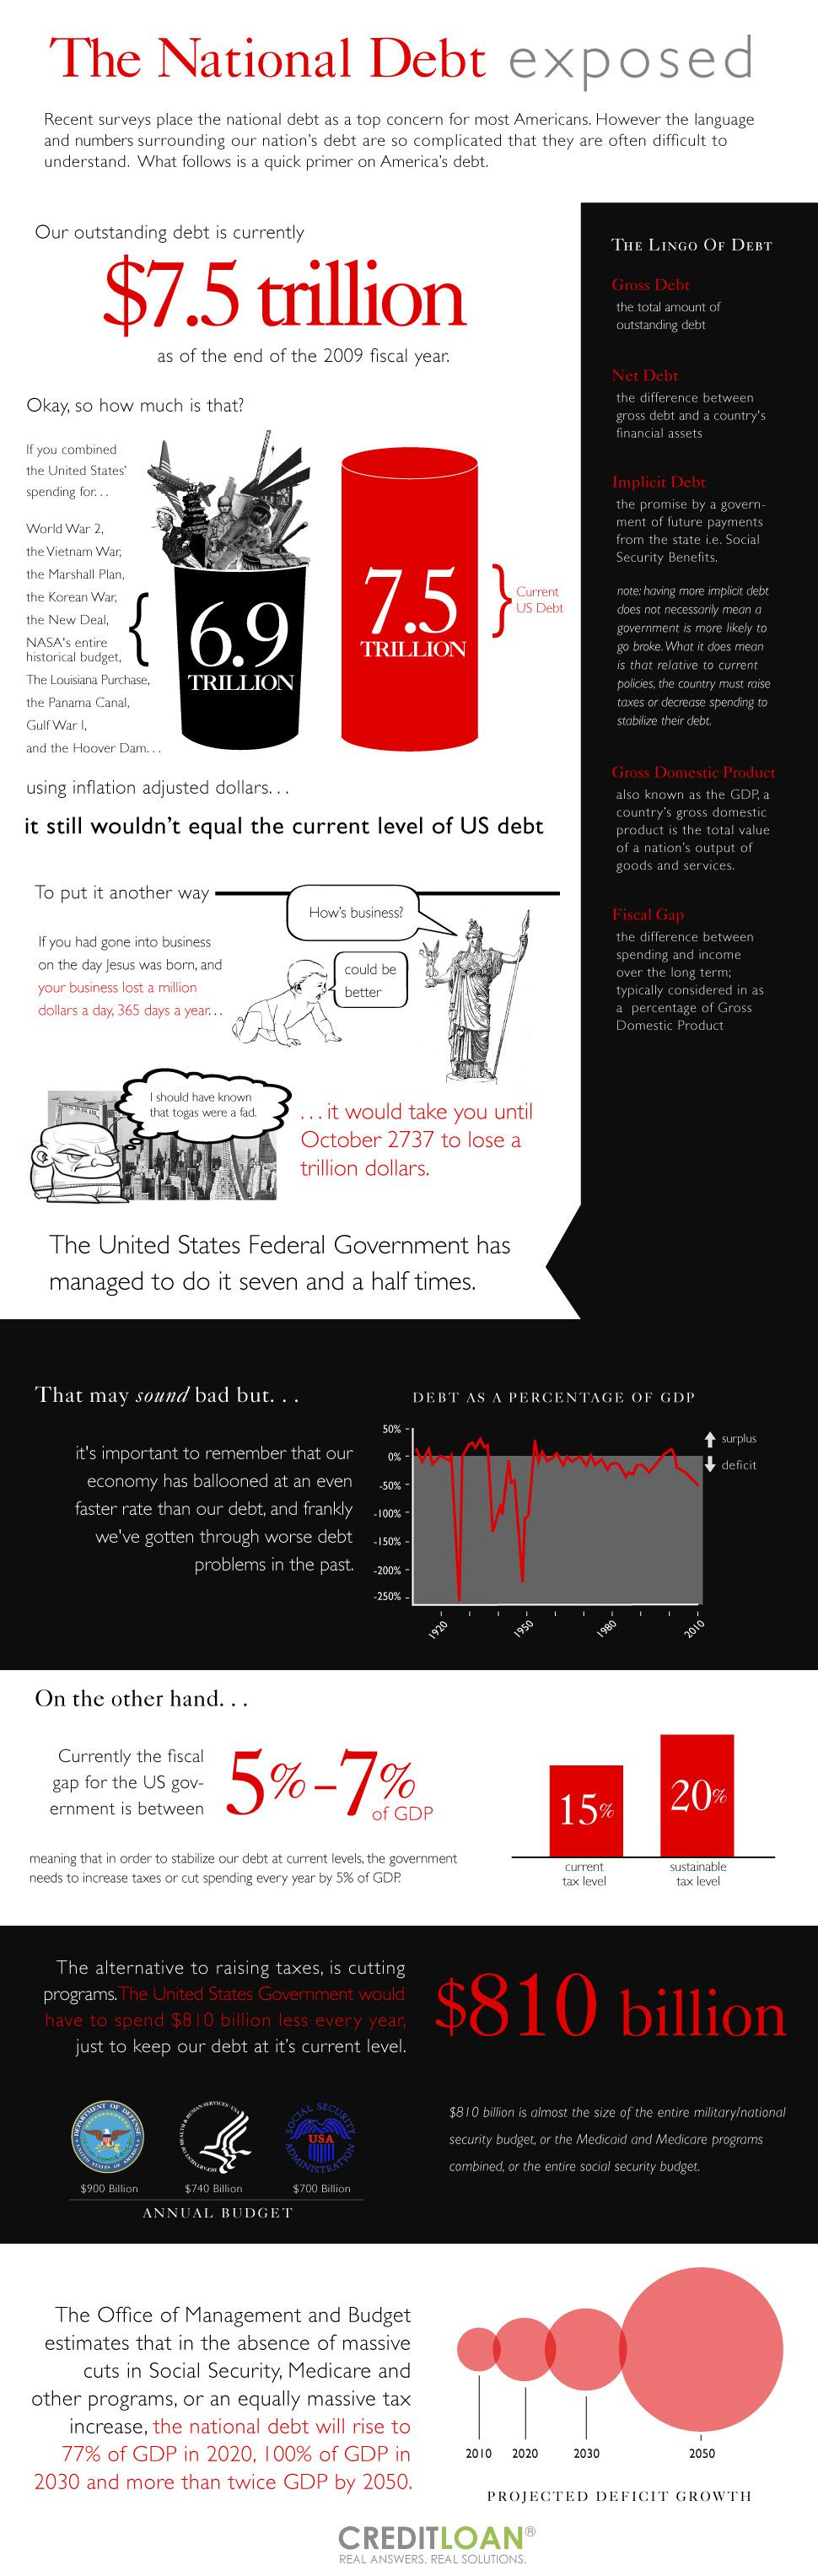
National Debt Numbers More Than a Little Scary
Running a superpower costs a lot of money; just ask America.
The United States is currently in debt — we all know that.
Many of us know that the national debt stood at a rather frightening $7.5 trillion at the end of the 2009 fiscal year.
Many U.S. residents even identify the size of the national debt as one of their top worries.
But it’s not easy getting a handle on what $7.5 trillion really means.
It’s also difficult to understand just how fast the country’s debt can grow.
Fortunately, there are some ways to put the U.S. debt picture into better perspective.
For instance, the amount of money the United States spent on World War II, the Vietnam War, the Marshall Plan and the Korean War don’t even come close to matching the size of the United States’ national debt.
In fact, you’d have to add the amount of money the country spent on the New Deal, NASA’s entire historical budget, the Louisiana Purchase, Panama Canal, first Gulf War and Hoover Dam to get close.
And even then you’d be a few billion dollars short.
The cost of all the wars and projects mentioned above?
$6.9 trillion.
That, of course, is less than the national debt of $7.5 trillion.
Here’s another, even more sobering way, to look at it:
If you were born on the same day that Jesus was born, you’d have to lose a million dollars every day, a full 365 days a year, and it still would take you until October of 2737 to lose just $1 trillion.
What’s scary, of course, is that the United States has managed to lose $1 trillion an amazing seven-and-a-half times.
And the country wasn’t born until many, many years after Jesus’ birth.
Stabilizing the national debt is no easy task, either.
The U.S. government would have to take some significant steps to do this.
For instance, the government would need to boost taxes or cut spending by 5 percent of the country’s Gross Domestic Product every year to keep the national debt at $7.5 trillion.
Yes, that’s to keep it there, not to reduce it in any way.
The country, in other words, would have to spend $10 billion less every year to keep the national debt where it is today.
That $10 billion figure is nearly equal to the country’s entire military budget or the combination of both Medicare and Medicaid.
It’s also equal to the country’s entire Social Security budget.
These are sobering numbers, but there is some good news!
First, the country has worked its way out of worse debt situations in the past.
Secondly, the U.S. economy has grown faster than the national debt. So there is hope that the country, if our politicians work together and stop bickering, can get its national debt under control.
National Debt vs GDP
The amount of debt of each of the worlds' countries is mapped out here as a percentage of the total Gross Domestic Product that each country produces.
For those personal budgeters out there, think of it as how much you owe versus how much you're making – on a macro scale

National Debt Projected at $19 Trillion for 2015
Welcome to the Weekly Credit Loan Report.
We’ll have a new infographic with accompanying blog post for you every week, detailing changes in the stock market and up-to-date info on national and consumer finances.
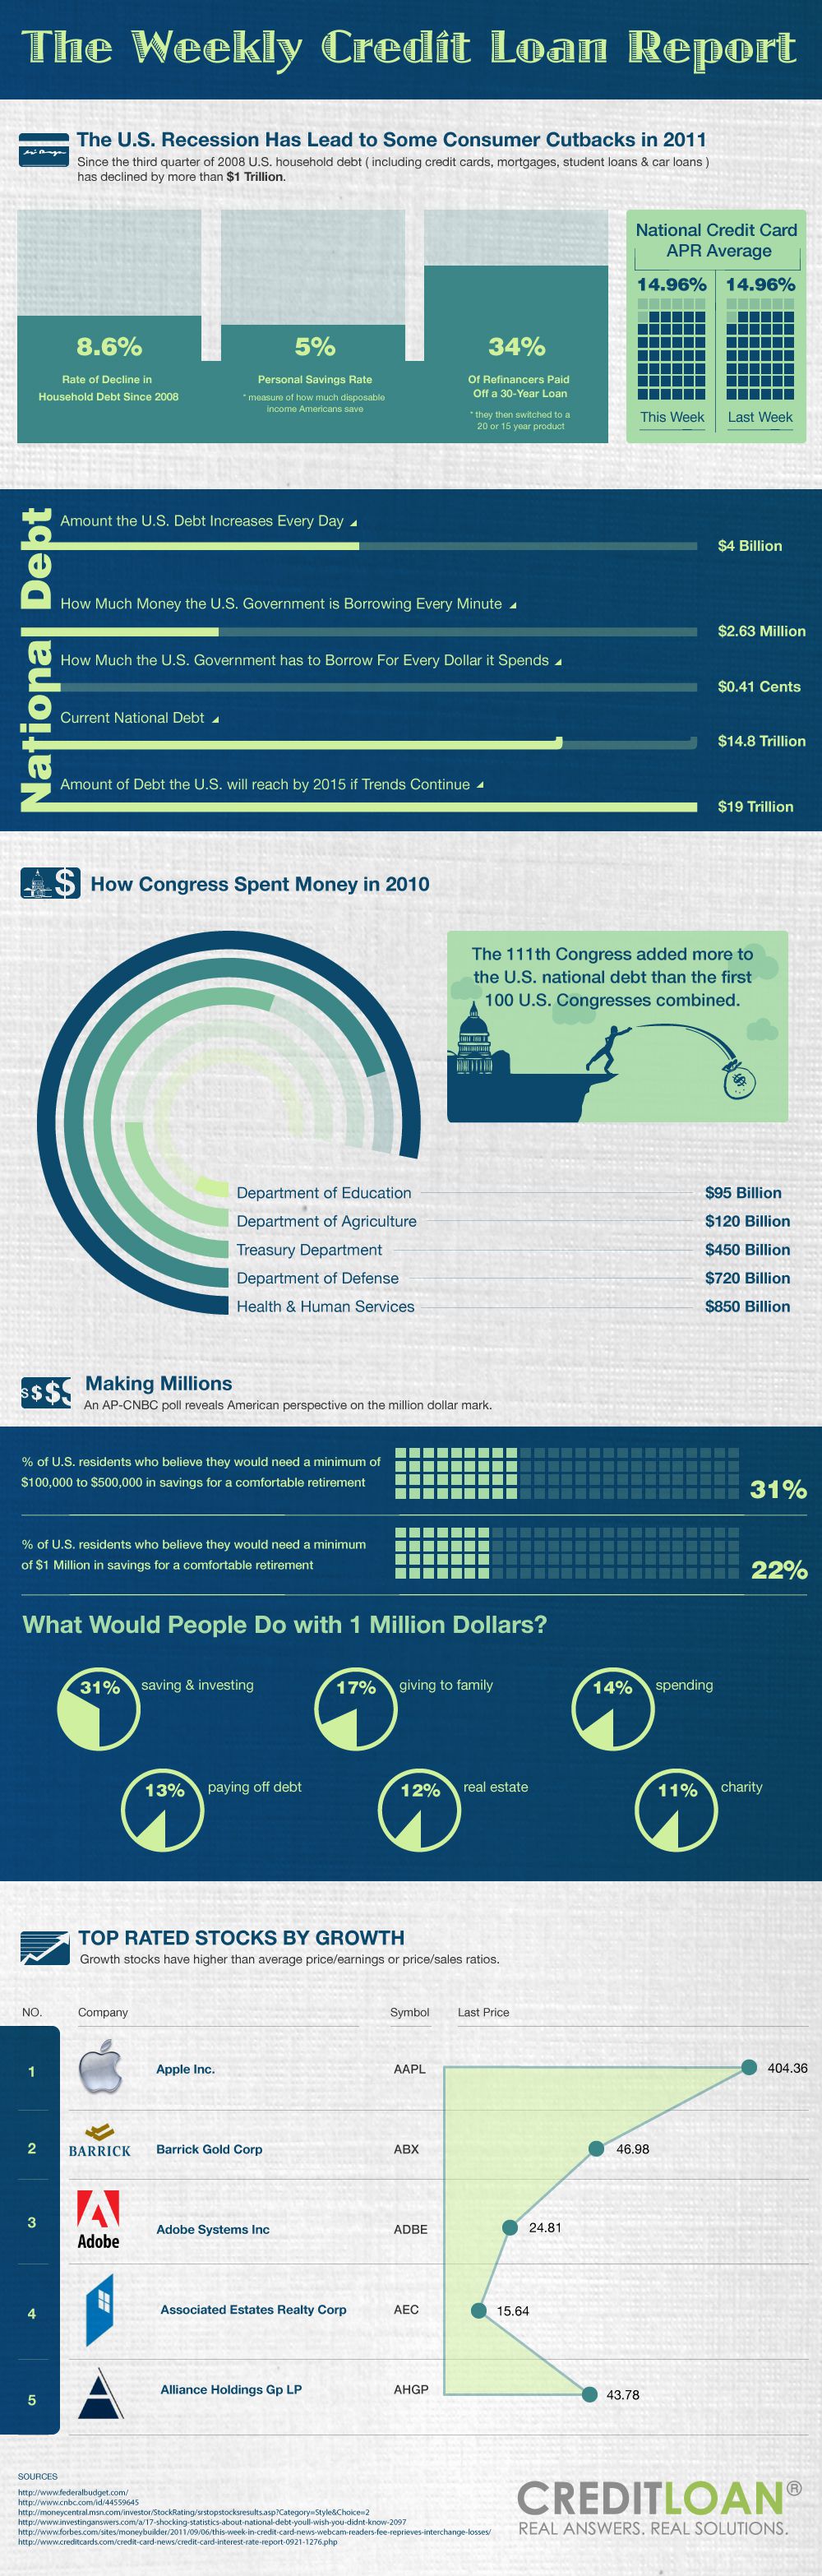
The national annual percentage rate on credit cards remained steady last week at 14.96%.
Americans currently save about 5% of their earned income, and they’ve been able to pay off household debt in amounts that have created an 8.6% rate of decline in total debt since 2008.
In comparison, the United States accrues an extra $4 billion in debt every single day–$2.63 million per minute.
This explains the current level of total national debt, at $14.8 trillion and growing.
At this pace, the country will be in an additional $4.2 trillion of debt, totaling $19 trillion by the year 2015.
How did we get so far in the hole?
The 111th Congress increased our national debt by more than the 1st through 100th Congresses all together, sinking the most money by far into Health & Human Services ($850 billion) and the Department of Defense ($720 billion) in 2010.

While less than one-quarter of Americans feel they’d need at least $1 million to retire securely, nearly a third say they’d want between $100,000 and $500,000.
If they had $1 million, what would they do with it?
The most popular answers are investment and savings (31%), giving to family (17%) and spending (14%).
Stocks favored technology giant Apple Inc. (AAPL), which grew to reach share prices of 404.36 last week.
Coming in at #2 for growth was Barrick Gold Corp. (ABX) at nearly 1/10th of the price — 46.98. At barely more than half of Barrick in the #3 spot was Adobe Systems Inc. (ADBE) at 24.81.
Associated Estates Realty Corp. (AEC) had a price of 15.64, and Alliance Holdings Group LP (AHGP) grew to 43.78 per share.