Across the country, more than half a million Americans are currently homeless. Of them, roughly 15 percent are considered chronically homeless, meaning they have a disability and have been homeless for 12 months or longer, or they have a disability and have been homeless at least four times in the last three years.
American homelessness can have many faces. More than 47,000 homeless men and women are veterans, 110,000 are LGBTQ youth, over 206,000 are a part of families, and roughly half are over the age of 50.
To better understand the state of homelessness in the U.S. today, we utilized HUD Exchange yearly data to determine which states had the highest population of homeless Americans, the rising and falling trends, and how many of those without homes currently live in unsheltered conditions. Read on to see what we uncovered.
Homelessness in Your Area
Using the interactive map above, you can explore the severity of homelessness in your state. Simply click on your state to view current statistics.
The largest per capita populations of Americans who were homeless were typically found in Pacific states. While the threat of colder temperatures can lead to serious medical conditions and even death for unsheltered people, warmer climates are not without their own dangers.
According to the data, Hawaii, New York, Arkansas, and Oregon had the highest per capita homeless populations between 2007 and 2016, while Arizona, Mississippi, and Virginia had some of the lowest rates.
Patterns in Homelessness Across the U.S.
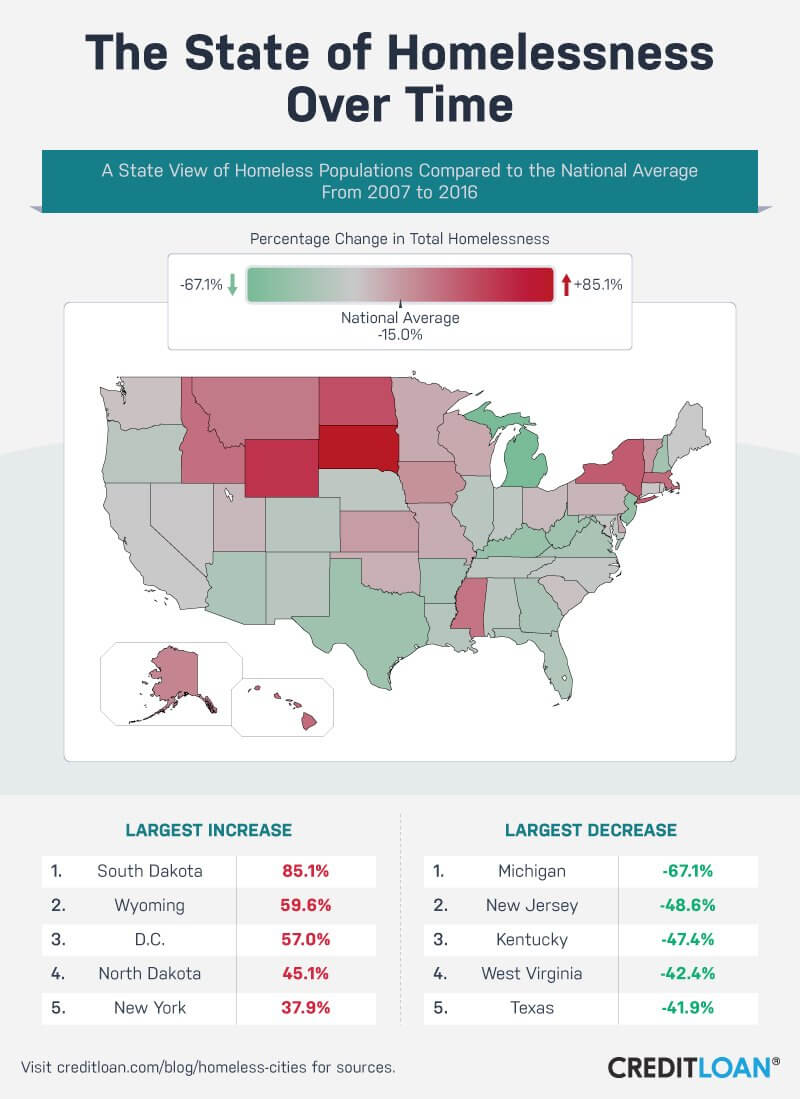
Our study of HUD Exchange data between 2007 and 2016 revealed that some states have more work to do to bring their homeless populations below the national average – and those states are typically home to some of the last remaining federally recognized Native American tribes.
While the national average of homelessness decreased between 2007 and 2016, South Dakota saw the largest increase in homeless Americans compared to the national average. Two groups stand out as comprising a larger percentage of the state’s homeless population: children and Native Americans. In one assessment in 2017, the South Dakota Housing for the Homeless Consortium (SDHHC) found that over 1 in 5 homeless Americans in South Dakota were children. Of the homeless individuals accounted for, 57 percent were Native American. In fact, the nine federally recognized tribes in South Dakota are among the poorest in the country.
In Wyoming and North Dakota – where homelessness is also above the national average – Native Americans contribute significantly to the rising number of Americans struggling to find permanent shelter in the Midwest. Harsh winters and dangerously cold weather can spell tragedy in these states, and a lack of established infrastructure can make building new housing developments extremely expensive.
Lack of Shelter Over Time
In 2016, the U.S. Department of Housing and Urban Development (HUD) indicated that while more than two-thirds of America’s homeless population resided in shelters, transitional housing, or safe havens, nearly 1 in 3 lived in an unsheltered location. Unsheltered homelessness is defined as a person sleeping outside or in a place not meant for human habitation, like a park bench. In some instances, a rising unsheltered homeless population can be attributed to rising rent, reduced availability of homeless assistance resources, and barriers to available assistance (like shelters that won’t accept pets or people with mental illness).
Between 2007 and 2016, the percentage of homeless Americans classified as unsheltered increased significantly in certain areas of the country. In Wyoming, the unsheltered homeless population increased by nearly 17 percentage points, rising from 26.1 percent to 42.7 percent. In Montana, the difference between 2007 and 2016 was an increase of 18.7 percentage points and more than 14 percentage points in North Dakota.
Still, some states also saw a rapid decline in unsheltered homelessness. While more than half (59 percent) of the homeless population in Michigan lived in unsheltered conditions in 2007, that number fell to just over 10 percent in 2016. In New Hampshire, where more than 43 percent were unsheltered in 2007, only 1 in 10 remained without some form of housing in 2016.
Efforts to End Homelessness


While some states have seen a dramatic increase in homeless populations, others have seen a sharp decline from 2015 to 2016.
In North Dakota, the number of homeless Americans decreased by over 29 percent in the last year. Back in 2007, the North Dakota Interagency Council on Homelessness proposed a 10-year plan to end long-term homelessness. Meanwhile, Vermont experienced a 26.7 percent decline in homelessness in the last year, however federal cuts could jeopardize the state’s homelessness programs.
States with similar declines in their homeless population between 2015 and 2016 included West Virginia (24.4 percent), Montana (17.0 percent), and Nevada (15.4 percent).
The Trends in Homelessness
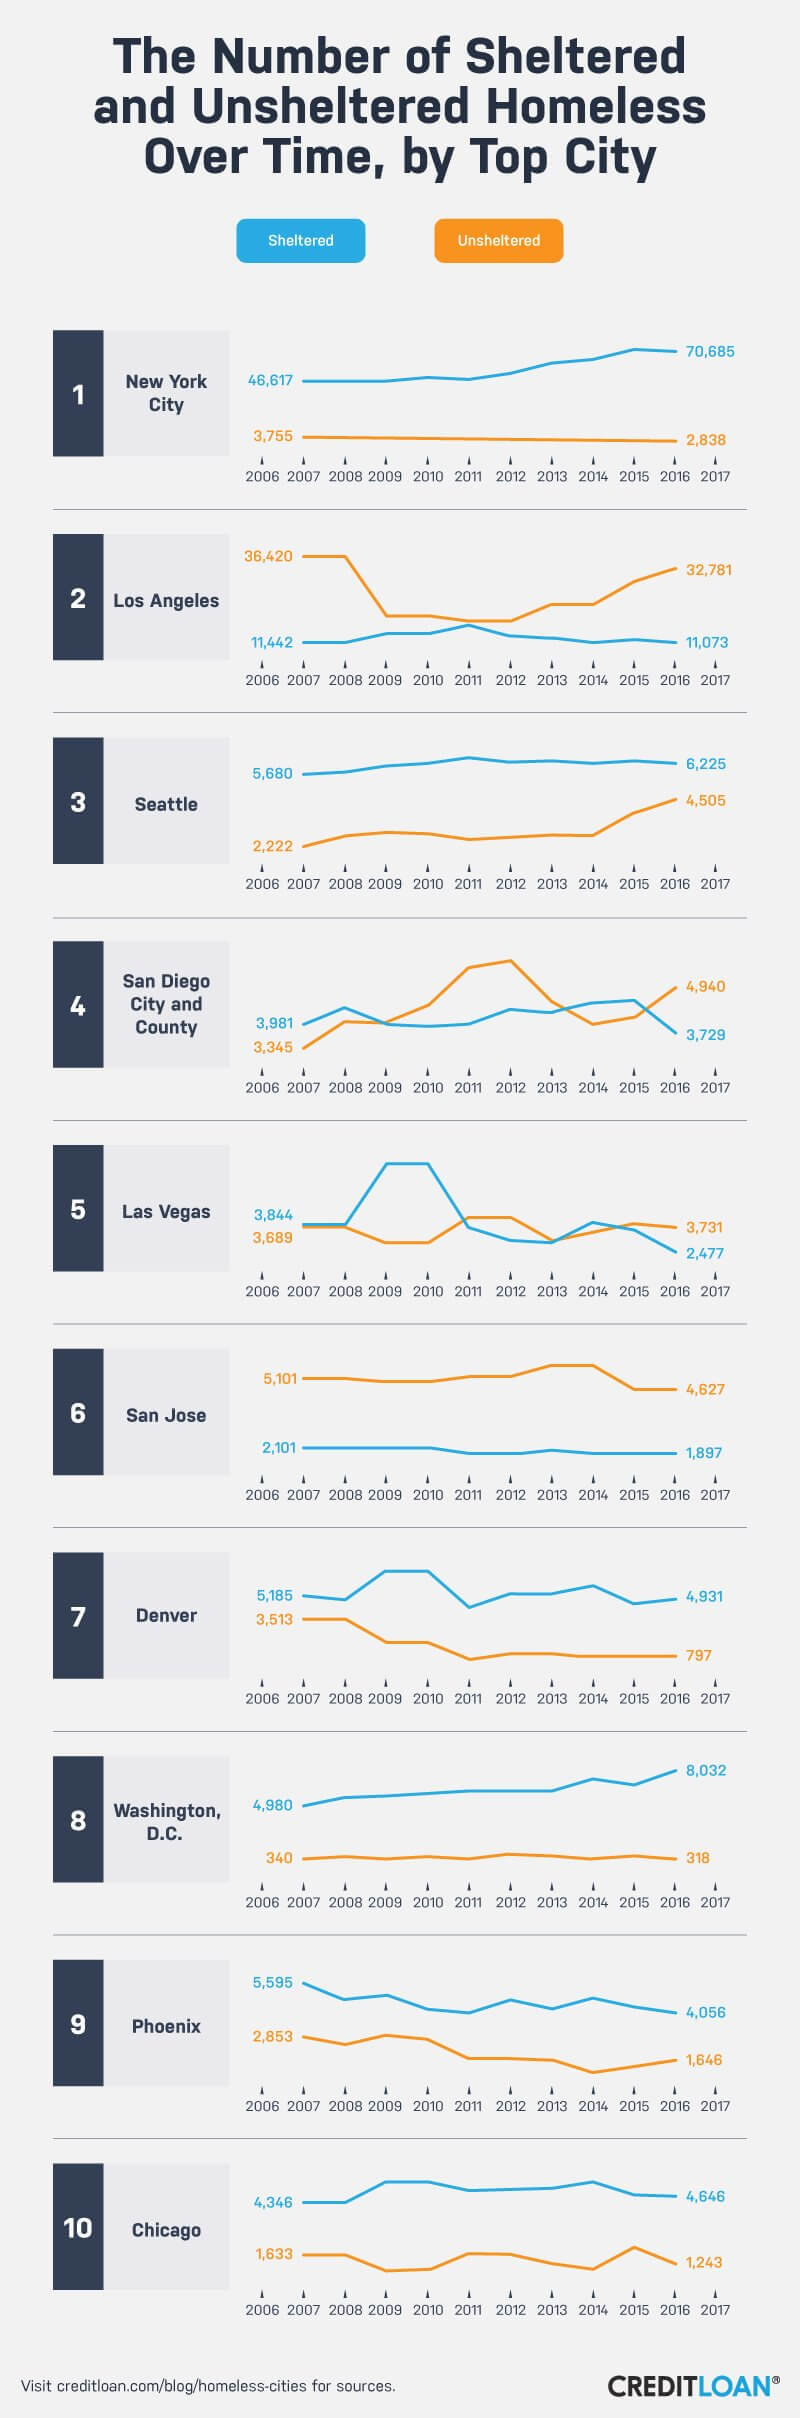
In New York City, the population of sheltered homeless Americans has been growing in recent years. The city may spend $1.2 billion a year to help curb this rising rate, but those efforts aren’t expediting the working poor in escaping the threat of stagnant working wages and sky-high rents.
The trends in Los Angeles point to a near opposite crisis. While the number of sheltered Americans classified as homeless has stayed relatively steady since 2007, the number of unsheltered homeless living in L.A. has climbed significantly in the last few years. The largest increases have been among those aged 24 and younger, and a vast majority of the unsheltered homeless population are either African-American or Hispanic. Like New York City, Los Angeles officials indicate rising housing costs as largely to blame for the dramatic upsurge. Between 2000 and 2015, the median rent in L.A. increased by more than 30 percent.
Of the 10 cities in the U.S with the highest populations of homeless Americans, four (San Diego, Las Vegas, San Jose, and L.A.) had higher rates of unsheltered Americans who are homeless than sheltered Americans as of 2016.
Urban Homelessness
While some rates of homelessness have ebbed in recent years, some of America’s biggest cities have seen surges in the number of people living without permanent shelter or care. In certain metropolitan areas, an influx of wealthy residents has resulted in a dramatic increase in the cost of living and housing, leaving low-income residents without places to live. This has resulted in tent-like communities popping up in some of America’s most populated cities.
Our study found that among larger cities, New York City, Los Angeles, and Seattle experienced some of the steepest increases in their homeless populations between 2015 and 2016. By 2016, New York City had more homeless people than any year since the Great Depression – roughly 75,000, or a 27 percent increase over the city average. While a vast majority of the people do not live unsheltered, those who do risk serious illness and injury as a result of colder climates and street violence.
Conclusion
Across the country, the number of Americans without permanent housing has fallen in recent years. Still, some of America’s most prestigious and well-known cities have seen a rapid increase in not only their homeless populations but also the number of people currently living without any shelter at all. In some cases, these people work the equivalent of full-time jobs, but simply cannot afford the rising costs of living in their cities or states.
Methodology
We looked at yearly data from 2007 to 2016 from HUD Exchange. We cross-referenced the data from HUD Exchange to climate data from NOAA to create our interactive map showing state average temperature and prevalence of homelessness.
Fair Use Statement
If you found this research into homelessness across America compelling, feel free to share this information with anyone you’d like for noncommercial purposes. We only ask that you link back to this page to give attribution to the authors.