In 2016, the average college graduate had accrued nearly $28,800 in student debt. A slight dip from the previous year, that figure still represents nearly the maximum that many undergraduate students are allowed to borrow in federal loans: $31,000.
For the first time in 2016, more Americans were employed with a college degree (36 percent) than those without (34 percent), and in 2015, the pay gap between working citizens with a college degree compared to high school graduates increased to 56 percent.
These numbers may seem striking, but do they tell the whole story? To learn more, we’re shining a light on metropolitan areas where Americans without a college degree earn the most money on average, what their annual income looks like in the biggest (and smallest) cities, and which professions could be the most lucrative for people without a postsecondary education. Read on to see what we discovered.
Visualizing the Workforce
Utilizing our interactive display, you can explore how Americans without a college degree fair in various metropolitan areas.
Below are the most important factors when considering where to live according to 20 respondents without a college degree. Metropolitan areas were based on a living wage (the minimum amount a full-time employee needs to earn to support a family), average salary, and poverty rates. Overall, the most important factor was the ratio of income to living wage.
In Good Company

On average, more than 1 in 3 working Americans today has a college degree – but that doesn’t necessarily hold true everywhere in the U.S. Our research found the top metropolitan areas by population where it was significantly less common to have completed any higher education.
In Chambersburg-Waynesboro, Pennsylvania, where agricultural production ranked as the leading industry and the cost of living was 9 percent below the national average, 70 percent of adults didn’t have a college degree. Earning nearly $20,470 annually without a degree, this small Pennsylvania town could be one of the most popular areas for Americans without a postsecondary education.
Small cities aren’t the only places where people without a degree can make some money, though. In more populated areas like Rockford, Illinois, and Lancaster, Pennsylvania, more than half of Americans had no college degree and earned over $20,000 annually.
Still, in more populated areas like Palm Beach, Florida, New York City, and Los Angeles, higher percentages of uneducated workers don’t always go hand in hand with higher wages, particularly when the cost of living can be far steeper.
Are They Earning Enough?
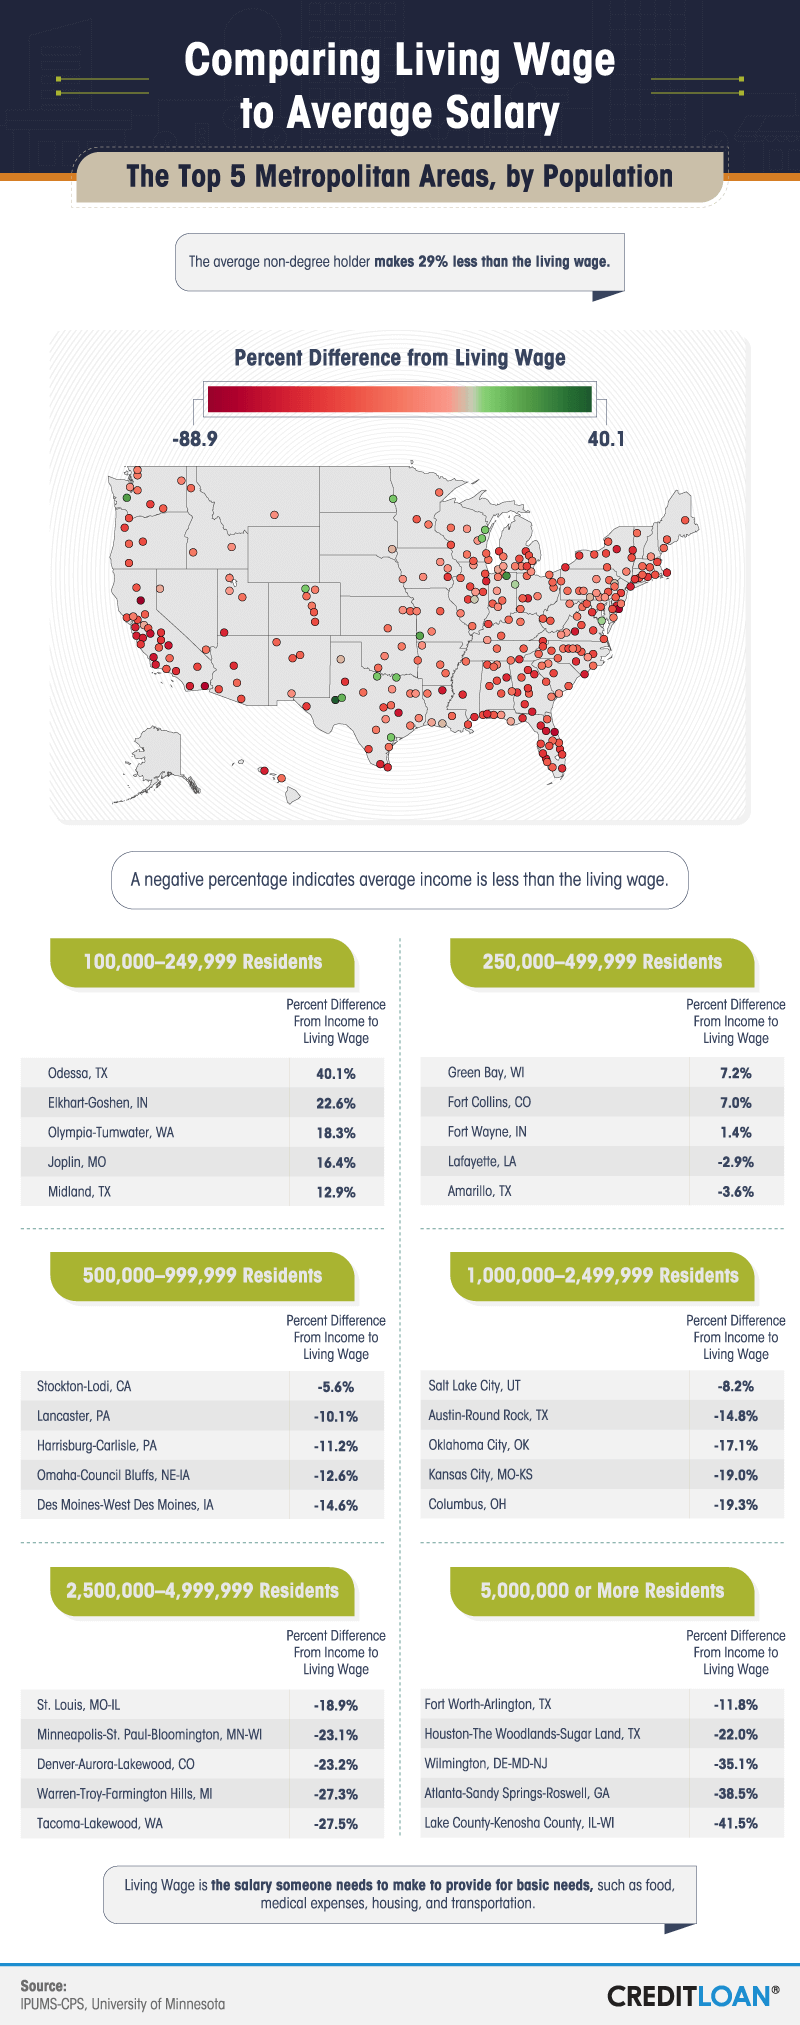
For the millions of employed Americans without a college degree, earning a living wage (the approximate income families need to earn to meet their basic needs) with enough left over for savings, retirement, or entertainment isn’t always guaranteed.
While the average annual salaries Americans without a higher education make in some of the biggest cities fail to qualify as a fully livable wage, Americans living in smaller parts of the country may have more than a few dollars left at the end of the month.
In more rural areas like Odessa, Texas, the cost of living might be 3 percent less than the national average, but Americans working in this energy- and education-focused region earned more than 40 percent over a living wage without a college degree. Similarly, Americans living in more densely populated areas like Green Bay, Wisconsin, and Fort Collins, Colorado, earned more than 7 percent over the living wage without a college degree – usually focusing on industries ranging from health care to bioscience.
In more major metropolitan areas, Americans without a college degree were less likely to find work that earned them a living wage. At best, cities like Salt Lake City (8 percent below a living wage), Austin, Texas (almost 15 percent below), and Oklahoma City (17 percent below) represented the highest average incomes for non-degree holding workers.
Money, Money, Money

While metropolitan areas of various sizes reporting the highest average incomes failed to match the median combined U.S. income ($44,148), several came close.
Based on our study, smaller cities may be more financially viable for employed Americans without a college degree. In Odessa, Texas, the average American without a college degree earned nearly $37,800 – more than twice what Americans in New York, Los Angeles, and West Palm Beach, Florida, made. Other small areas like Midland, Texas; Olympia-Tumwater, Washington; and California-Lexington Park, Maryland; also posted the highest average incomes.
Conclusion
Studies have shown employed Americans with college degrees generally earn more than those without – and the gap between college grads and everyone else only seems to be widening. Still, for the millions of working Americans without a degree, there are metropolitan areas where they can earn more than a living wage.
Before deciding on a job change, you may also want to take the cost of living into account and consider the potential value of moving to a smaller city where more Americans than not work despite the absence of a college degree.
Methodology
We collected data from the University of Minnesota’s IPUMS-CPS database. We reached out to the agency and received permission to use the data for website content. We pulled the following variables for 2013 to 2017 from the database for our analysis:
- YEAR
- STATEFIP
- CBSASZ
- METFIPS
- CPSID
- WTSUPP
- AGE
- SEX
- EDUC99
- EMPSTAT
- LABFORCE
- OCC2010
- IND1950
- INCWAGE
- OFFPOV
Across the years analyzed, we looked at 972,615 records that were then weighted. WTSUPP is the variable used to calculate weights applied to this survey. All values seen are weighted using these provided variables, which are calculated to be a more accurate representation of the American population. For the purposes of this analysis, anyone who had any type of college degree was excluded. We focused on those who had education through to some college but no degree. There were multiple metropolitan codes that changed between years, so we made all of the codes uniform. There were also multiple metropolitan areas that were classified as being two sizes. This happened from year to year as well as within the same year. We contacted IPUMS about this, but at the time of publication, we had not received a response. Because of this, any metropolitan area that fell under two size categories was classified as the size that matched the current population data from https://datausa.io/.
Metropolitan area names and groupings were defined using two census data sets, which can be seen here and here.
For the analysis on living wage, we used data from MIT’s Living Wage Calculator for all metropolitan areas. Not all metropolitan areas in the IPUMS data corresponded to living wage metropolitan areas. Because of this, those areas were not included in our overall ranking of cities, nor were they represented in the visual focused on living wage and salary. The metropolitan codes for these areas are as follows:
- 11300
- 11340
- 26100
- 39100
- 72850
- 74500
- 77350
- 78700
The living wage data we obtained was in the form of hourly payment. It was multiplied by 2,080 to arrive at the annual living wage – defined by MIT as the wage an individual would need to earn to support his or her family if they were the only provider and working full time (or 2,080 hours a year).
To arrive at our meta ranking for the best overall cities, which we did not have an established source to calculate, we conducted a short survey among 20 people using Amazon’s Mechanical Turk service to determine our own score. Respondents were asked their highest level of education, and those with any degree were disqualified. The remaining respondents were then asked to rate the factors used in our score on how important they would be when deciding on a place to live. There were no attention check questions in this survey.
The weights for the scenarios are as follows:
Answer Choices | Weighted Average (Scale of 1–5) | Percentage of Total Points |
Minimum wage you need to make to survive in this area (living wage) | 3.6 | 0.213018 |
The living wage compared to the average salary of people with your level of education in that area | 3.75 | 0.221893 |
The average poverty level in the area for people with your level of education | 3.4 | 0.201183 |
The number of people in the area with a similar education level as you | 2.6 | 0.153846 |
The average salary of people with a similar education level as you | 3.55 | 0.210059 |
Total points | 16.9 |
We then ranked every metropolitan area 1 through 306 in each of these categories and multiplied the rank position by the percentage that corresponded to that category. This produced an overall composite score, which was used to determine the “best” area. Best was considered the lowest overall score after our rankings and weighting.
Limitations
We did not include an attention check question in the survey on the ranking values, so it is possible our results are skewed by respondents who did not take the survey seriously.
The data we are presenting rely on self-reporting. There are many issues with self-reported data. These issues include but are not limited to: selective memory, telescoping, attribution, and exaggeration.
No statistical testing was performed, so the claims listed above are based on means alone. As such, this content is purely exploratory, and future research should approach this topic in a more rigorous way.
Fair Use Statement
Feeling educated by these results? Feel free to pass them along for noncommercial purposes. Just make sure you give credit where it’s due, and link back to this page and its authors.