How the Average U.S. Consumer Spends Their Paycheck
If you're already thinking about to your 2019 budget, it may be helpful to look back on previous years to understand where money has previously been allocated.
One key to successful budget-building includes having an accurate average of your regular expenses to plan for the future.
Our breakdown of average American expenses from 2006 to 2016 may help do just that. By understanding how much the typical family spends on housing, food, entertainment, reading and more – and how these expenses fluctuate over the years –planning for the future won't be such a shot in the dark. Keep reading to learn more.
Adding It All Up
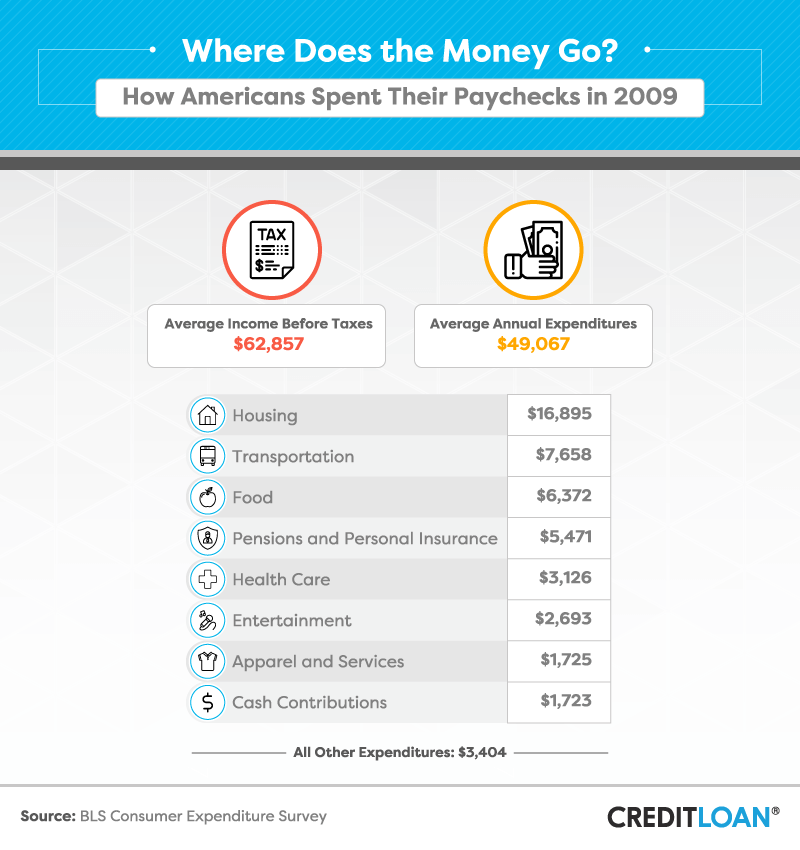
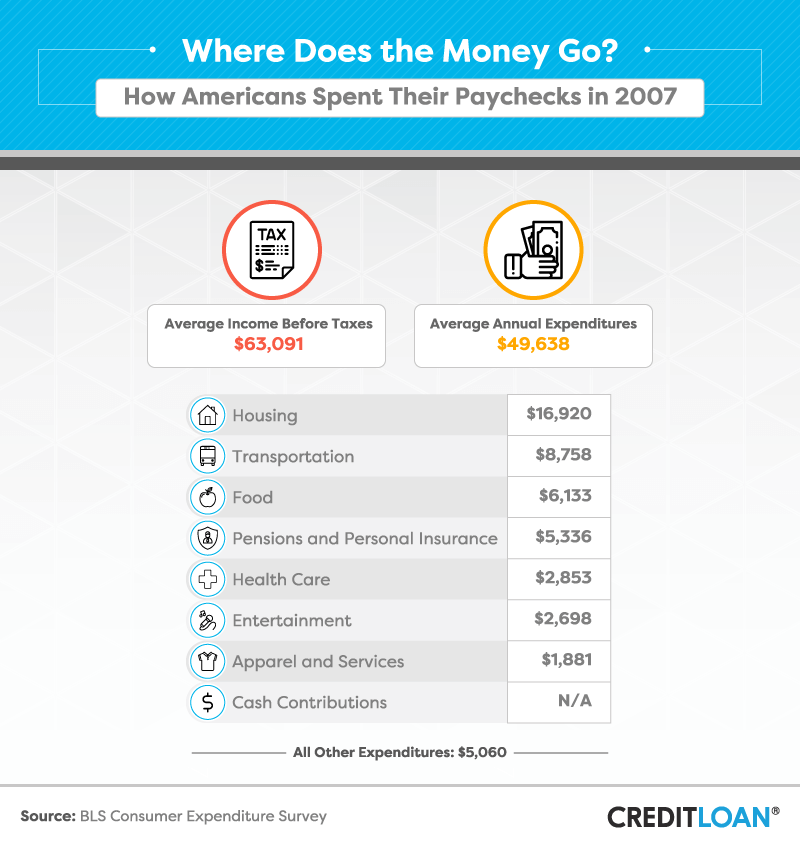
According to the Bureau of Labor Statistics, the average American family earned $74,664 (before taxes) and spent $57,311 across various expense categories in 2016.
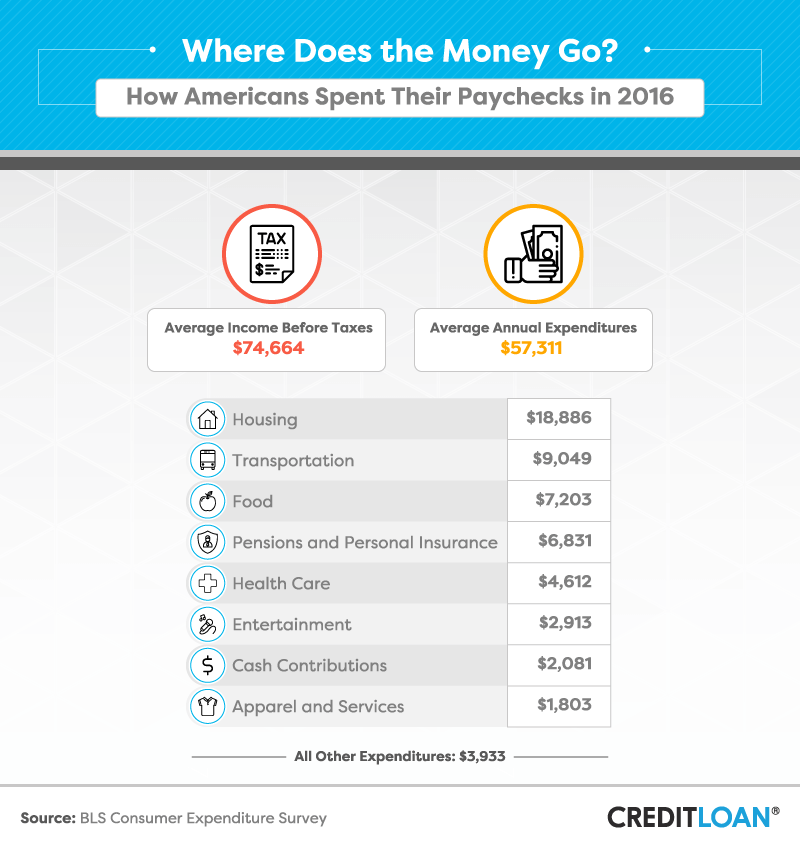
Leading the way at nearly $18,900 each year, housing accounted for the biggest expense in most Americans' lives. Despite being a quintessential element of the American Dream, younger generations are less likely to own homes, and rent continues to rise. Still, despite some misconceptions about what it takes to qualify for a mortgage, one survey found most renters wished they owned a home and pointed to financial hardships as a roadblock to this reality.
Following housing costs, transportation ($9,049), food ($7,203), and pensions and personal insurance ($6,831) topped the list for the biggest ticketed items on most Americans' budgets. For the majority of people who prefer not to cook, the cost of dining out could add up big. The occasional luxury experience may not seem like a big drain on the average budget, but entertainment, cash contributions, and apparel and services accounted for nearly $7,000 (over 10 percent) of most Americans' annual expenses.
A Boost in Spending
Since 2006, three of the most common expenses have increased by more than 20 percent: health care, pensions and personal insurance, and entertainment.
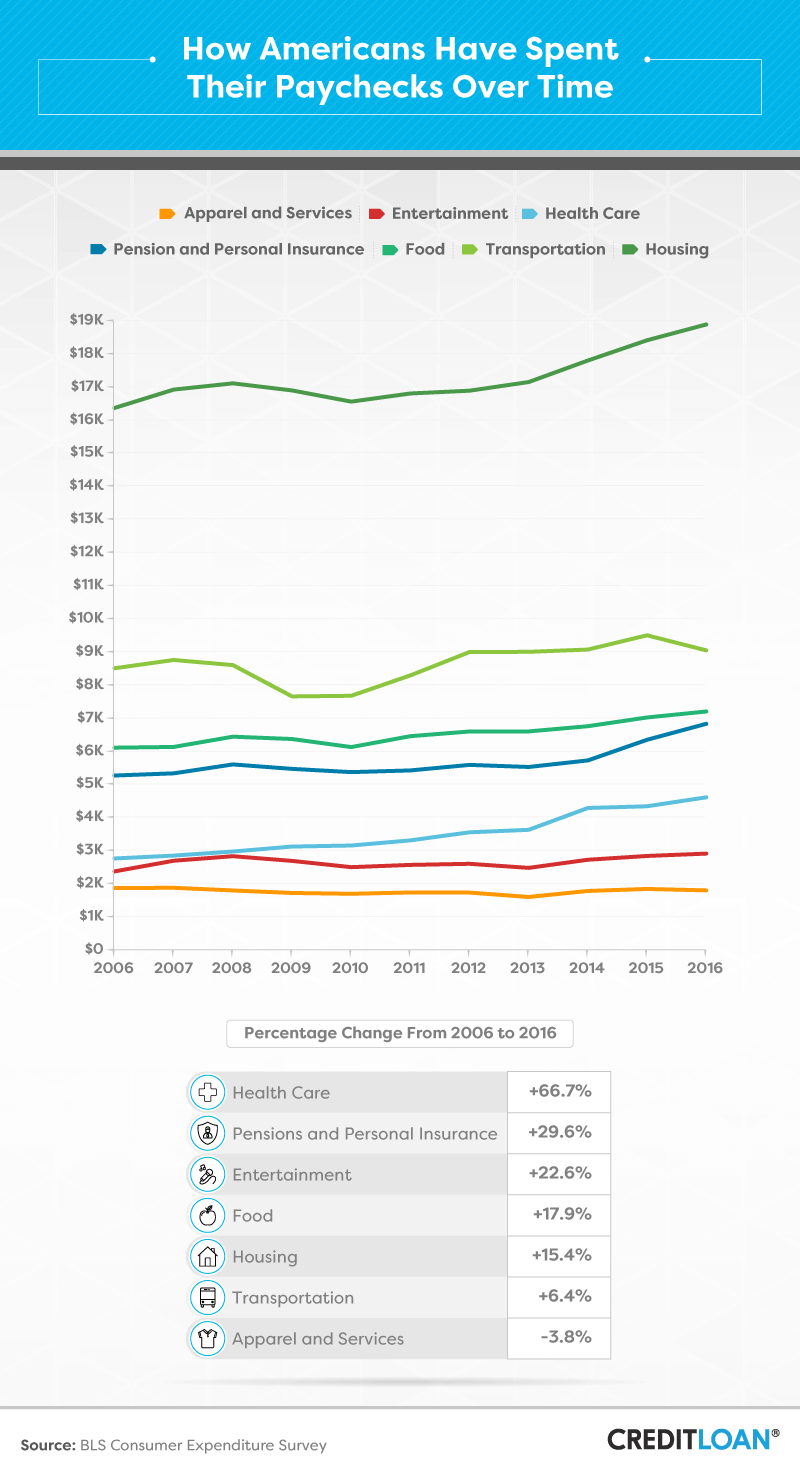
At an increase of nearly 67 percent since 2006, health care may not be the biggest budget item Americans worry about on a daily basis, but its cost per year has increased more than any other financial obligation in the last decade. As one of the most important political issues of 2017, Americans spend more on health care each year than any other country around the world.
While the amount of money spent on certain expenses may be out of most Americans' control, others can be seen as discretionary spending. With an increase of nearly 23 percent since 2006, the average American family spent over $2,900 in 2016 on entertainment, including going to the movies, seeing sporting events, and buying lottery tickets.
While a majority of household expenses have increased since 2006, people are actually spending less money in one category than they did 10 years ago: apparel and services. With a focus on experiences rather than stuff, Americans may continue spending less and less in the category of clothing and services.
Seeing Is Believing


Here you can explore how spending categories have changed over the last decade. Our interactive guide breaks down costs in every major category from 2006 to 2016 to show how things might further change in the future, and how much ebb and flow there really is when it comes to the average American's expenses.
Conclusion
Whether you're trying to fund the next big vacation or want to start saving toward retirement, building a successful budget could keep you from overspending and put you back in the driver's seat.
More than just adding up what you've spent in the past, knowing how the costs of necessities have changed over the years can help you more accurately predict what you should expect to spend in the future. In general, the expenses most Americans put their paychecks toward have increased significantly over the last decade, and depending on how you prioritize the needs and wants of your family, they could continue to increase even more.